


VAR Analysis on Factors Affecting Carbon Emissions from Land Use in Guangdong
-
摘要:
目的 分析广东省土地利用碳排放的影响因素,为广东省碳排放管理提供一定的科学依据。 方法 基于广东省1996—2017年的土地利用现状及社会经济统计数据,构建VAR(向量自回归模型),通过格兰杰因果分析、脉冲响应和方差分解,对广东省土地利用碳排放影响因素进行定量分析。 结果 近20年来,广东省土地利用碳排放整体上呈上升趋势;人均GDP,土地利用强度和能源强度与土地利用碳排放呈正相关,土地利用结构和产业结构与土地利用碳排放呈负相关;影响因子贡献率由大到小分别为:土地利用强度>产业结构>能源强度>人均GDP>土地利用结构。 结论 调整产业结构,推动能源结构转变,优化土地利用结构是目前广东省实现碳减排的关键。 Abstract:Objective Factors that affected the carbon emissions from land use in Guangdong Province were analyzed for improved environmental management. Methods Based on the 1996-2017 statistics, a vector autoregression (VAR) model was constructed for the carbon emissions in Guangdong. Using Granger causality analysis, impulse response, and variance decomposition, the impact of land uses on the carbon emission in the province was quantitatively analyzed. Results In the past two decades, the overall carbon emission from varied land uses in the province was on an upward trend. The per capita GDP, land use intensity, and energy intensity positively, but the structures of land use and industry negatively, correlated with the carbon emission. The contribution rates of those factor ranked by magnitude were land use intensity>industrial structure>energy intensity>per capita GDP>land use structure. Conclusion It appeared that fostering transformation on energy structure and optimizing structure of land uses were the key maneuvers the province needs to consider in order to realize substantial reduction on carbon emission. -
Key words:
- Land use intensity /
- carbon emissions /
- economic growth /
- VAR /
- Guangdong Province
-
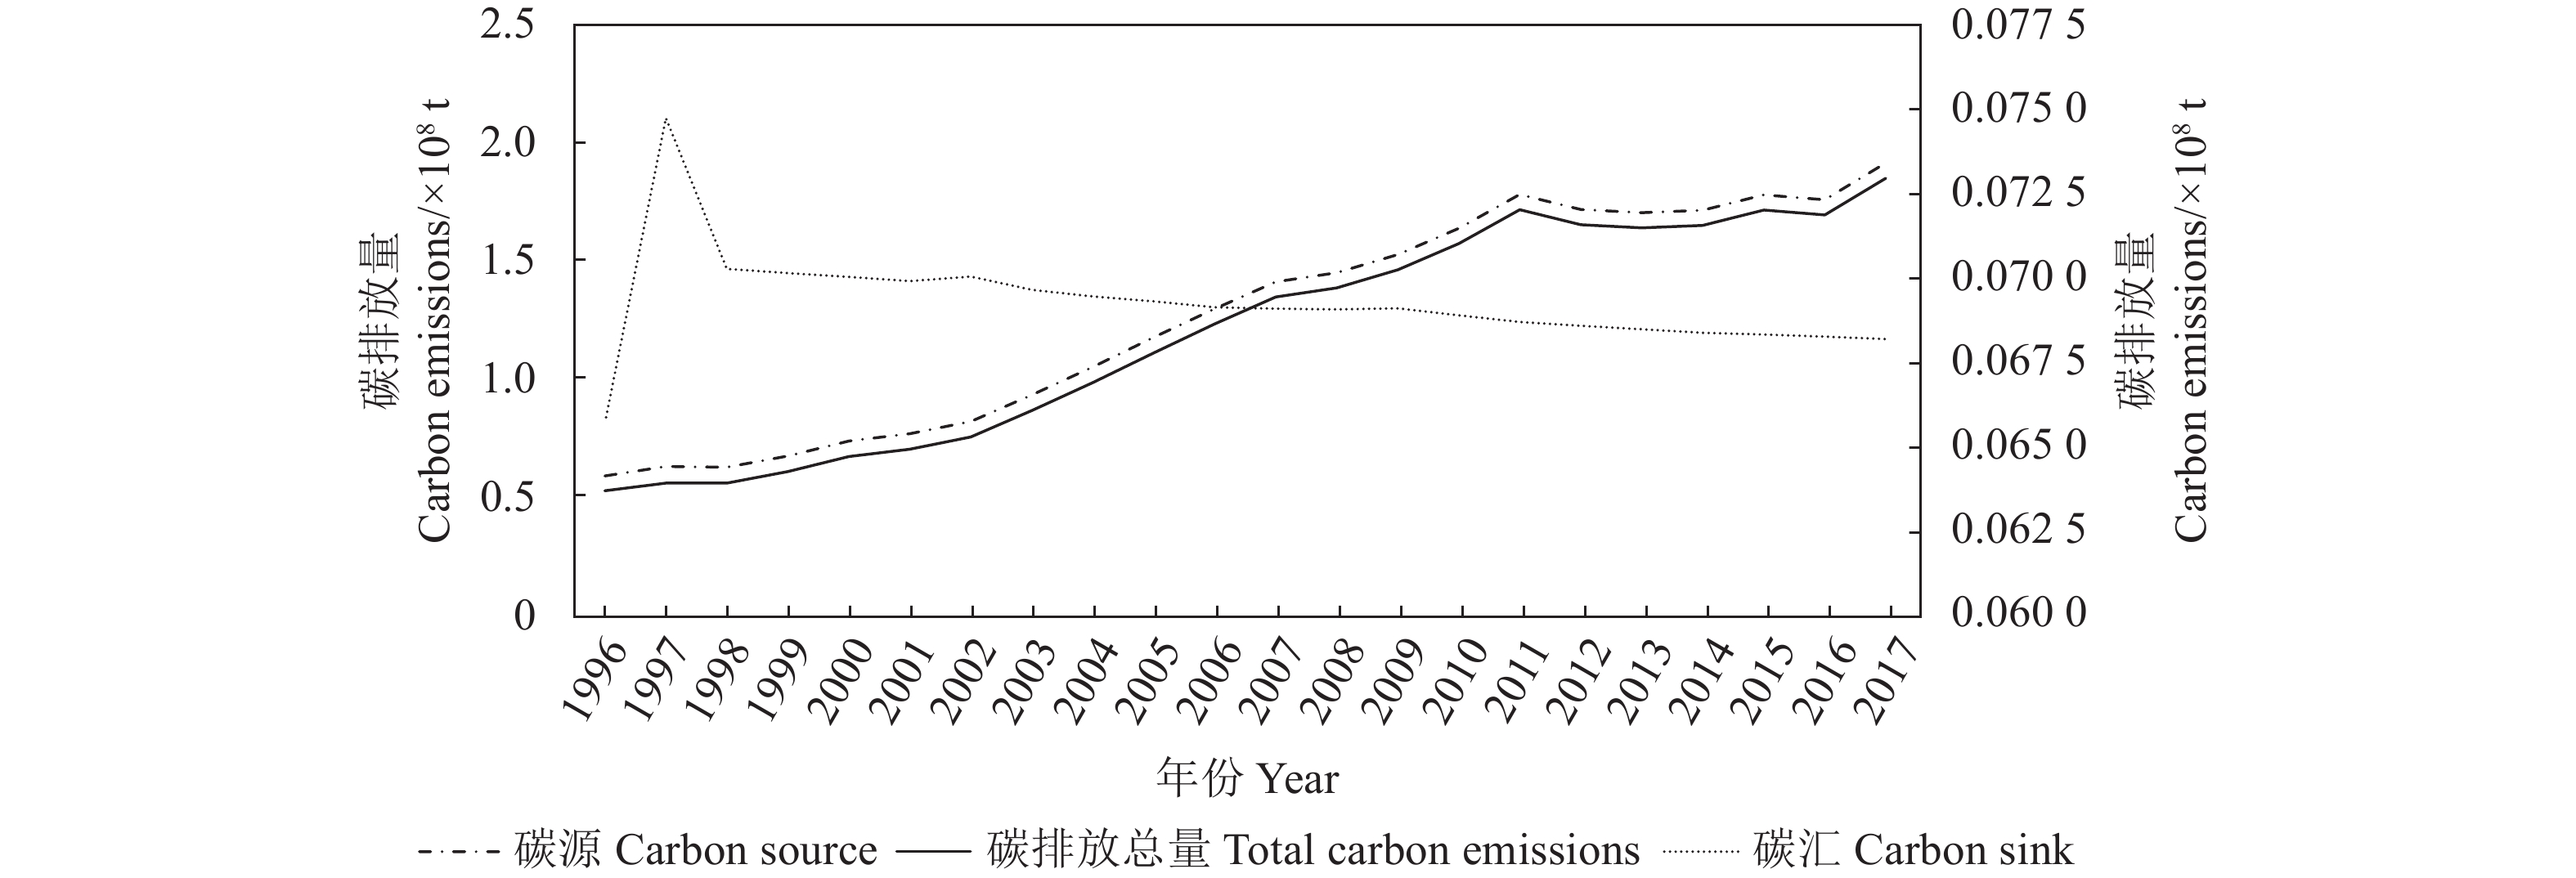
图 1 1996—2017年广东省土地利用碳排放
左侧坐标轴表示碳源及碳排放总量,右侧坐标轴表示碳汇。
Figure 1. Carbon emissions from land use in Guangdong from 1996 to 2017
The left axis represents carbon sources and total carbon emissions, and the right axis represents carbon sinks.
表 1 能源标准煤折算系数与碳排放系数
Table 1. Conversion coefficients of energy standard coal and carbon emission
能源种类
Energy type标准煤折算系数
Standard coal
conversion factor/tec碳排放系数
Carbon emission
factor/(tc·tec−1)原煤 Raw coal/t 0.7143 0.7559 焦煤 Coking coal/t 0.9714 0.8550 原油 Crude oil/t 1.4286 0.5857 汽油 Gas oil/t 1.4714 0.5538 煤油 Kerosene/t 1.4714 0.5714 柴油 Diesel/t 1.4571 0.5921 燃料油 Fuel oil/t 1.4286 0.6185 液化石油气 LPG/t 1.7143 0.5042 炼厂干气
Refinery dry gas/t1.5714 0.4602 其他石油制品
Other petroleum products/t1.2000 0.5857 天然气
Natural gas/(103•m3)−112.1430 0.4483 能源标准煤折算系数与碳排放系数分别参考《中国能源统计年鉴》和IPCC《国家温室气体排放清单指南》(2006年)。 Conversion calculations according to China Energy Statistical Yearbook and IPCC Guidelines for National Greenhouse Gas Emission Inventory (2006).  下载: 导出CSV
表 2 变量土地利用强度、经济发展与土地碳排放描述性统计
Table 2. Descriptive statistics of variable land use intensity, economic development, and land carbon emissions
变量 Variable 均值 Mean 最大值 Max 最小值 Min 标准差 Standard deviation 地均碳排放
LCE/(t·hm−2)8672.39 9209.81 7818.10 509.91 人均GDP
GDP/yuan27442.80 55028.41 9157.00 14948.34 能源强度
EGDP/(t standard coal/10 000 yuan)2.13 2.94 1.51 0.42 产业结构
IS0.43 0.52 0.34 0.05 土地利用结构
LUS0.09 0.11 0.06 0.01 土地利用强度
LA213.96 219.81 190.29 6.99
下载: 导出CSV
表 3 单位根检验结果
Table 3. Unit root test results
序列
SequenceADF检验
ADF test1%临界值
1% threshold5%临界值
5% threshold10%临界值
10% threshold结果
ResultLnLCE −1.852 3 −3.7880 −3.0124 −2.6461 非平稳 LnGDP −1.544 1 −4.4983 −3.6584 −3.2690 非平稳 LnLA −3.198 0 −4.4983 −3.6584 −3.2690 非平稳 LnLUS −1.701 2 −4.4983 −3.6584 −3.2690 非平稳 LnIS −3.016 4 −4.4983 −3.6584 −3.2690 非平稳 LnEGDP −2.813 4 −4.5716 −3.6908 −3.2869 非平稳 ∆LnLCE −3.894 1 −4.4983 −3.6584 −3.2690 **平稳 ∆LnGDP −4.385 9 −4.6679 −3.7332 −3.3103 **平稳 ∆LnLA −12.009 0 −4.4983 −3.6584 −3.2690 **平稳 ∆LnLUS −5.721 8 −4.4983 −3.6584 −3.2690 **平稳 ∆LnIS −2.052 8 −2.6857 −1.9591 −1.6075 **平稳 ∆LnEGDP −6.370 4 −4.4983 −3.6584 −3.2690 **平稳 *表示1%显著水平;**表示5%显著水平;***表示10%显著水平。
* at 1% significant level; ** at 5% significant level; *** at 10% significant level.
下载: 导出CSV
表 4 最佳滞后阶数的选择
Table 4. Selection of optimal lag order
滞后阶数
Lag orderLOGL LR FPE AIC SC HQ 0 220.9553 NA 0.0000 −21.4955 −21.1968 −21.4372 1 384.6752 212.835 8 0.0000 −34.2675 −32.1765 −33.8593 2 470.3642 59.9823* 1.6e-24* −39.2364* −35.3531* −38.4784*
下载: 导出CSV
表 5 Johansen协整检验结果
Table 5. Johansen cointegration test results
假定协整数量
Assumed cointegration number迹统计量
Trace statistics5%临界值
5% threshold最大特征值统计量
Largest eigenvalue statistic5%临界值
5% threshold无 Nothing 245.6617 103.8473 78.0065 40.9568 最多一个 At most one 167.6552 76.9728 54.9164 34.8059 最多二个 Up to two 112.7388 54.0790 43.41 9 28.5881 最多三个 Up to three 69.3269 35.1928 35.9915 22.2996 最多四个 Up to four 33.3354 20.2618 23.1432 15.8921 最多五个 Up to five 10.1923 9.1645 10.1923 9.1645
下载: 导出CSV
表 6 格兰杰因果检验结果
Table 6. Granger Causality test results
变量关系
Variable relationship原假设
Null hypothesisF统计量
F statisticProb 结论
ConclusionLnLCE与各影响因子间的因果关系检验
The causal relationship test between
LnLCE and various influencing factorsLnGDP不是LnLCE的格兰杰原因
LnGDP is not the Granger reason for LnLCE1.3502 0.2604 Accept LnLCE不是LnGDP的格兰杰原因
LnLCE is not the Granger reason for LnGDP13.8457 0.0016 ***Reject LnLA不是LnLCE的格兰杰原因
LnLA is not the Granger reason for LnLCE20.3356 0.0003 ***Reject LnLCE不是LnLA的格兰杰原因
LnLCE is not the Granger reason for LnLA5.03462 0.0377 ***Reject LnLUS不是LnLCE的格兰杰原因
LnLUS is not the Granger reason for LnLCE11.1064 0.0037 ***Reject LnLCE不是LnLUS的格兰杰原因
LnLCE is not the Granger reason for LnLUS9.36186 0.0067 ***Reject LnIS不是LnLCE的格兰杰原因
LnIS is not the Granger reason for LnLCE3.53485 0.0552 ***Reject LnLCE不是LnIS的格兰杰原因
LnLCE is not the Granger reason for LnIS3.0075 0.0797 ***Reject LnEGDP不是LnLCE的格兰杰原因
LnEGDP is not the Granger reason for LnLCE0.0396 0.8444 Accept LnLCE不是LnEGDP的格兰杰原因
LnLCE is not the Granger reason for LnEGDP0.9078 0.3533 Accept LnGDP、LnEGDP对其他因子的因果关系检验
The causal relationship test of
LnGDP and LnEGDP to other factorsLnGDP不是LnLA的格兰杰原因
LnGDP is not the Granger reason for LnLA0.2407 0.7891 Accept LnGDP不是LnLUS的格兰杰原因
LnGDP is not the Granger reason for LnLUS13.5481 0.0004 ***Reject LnGDP不是LnIS的格兰杰原因
LnGDP is not the Granger reason for LnIS5.8825 0.0130 ***Reject LnEGDP不是LnLA的格兰杰原因
LnEGDP is not the Granger reason for LnLA9.9247 0.0055 ***Reject LnEGDP不是LnLUS的格兰杰原因
LnEGDP is not the Granger reason for LnLUS5.3968 0.0321 ***Reject LnEGDP不是LnIS的格兰杰原因
LnEGDP is not the Granger reason for LnIS6.5393 0.0198 ***Reject *表示1%显著水平;**表示5%显著水平;***表示10%显著水平。
* means 1% significant level; ** means 5% significant level; *** means 10% significant level.
下载: 导出CSV
-
[1] 李键, 毛德华, 蒋子良, 等. 长株潭城市群土地利用碳排放因素分解及脱钩效应研究 [J]. 生态经济, 2019, 35(8):28−34,66.LI J, MAO D H, JIANG Z L, et al. Research on factors decomposition and decoupling effects of land use carbon emissions in Chang-Zhu-tan urban agglomeration [J]. Ecological Economy, 2019, 35(8): 28−34,66.(in Chinese) [2] STUIVER M. Atmospheric carbon dioxide and carbon reservoir changes [J]. Science, 1978, 199(4326): 253−258. doi: 10.1126/science.199.4326.253 [3] CALANCA P, VUICHARD N, CAMPBELL C, et al. Simulating the fluxes of CO2 and N2O in European grasslands with the pasture simulation model (PaSim) [J]. Agriculture, Ecosystems & Environment, 2007, 121(1/2): 164−174. [4] HOUGHTON R A. Magnitude, distribution and causes of terrestrial carbon sinks and some implications for policy [J]. Climate Policy, 2002, 2(1): 71−88. doi: 10.3763/cpol.2002.0206 [5] ALI G, PUMIJUMNONG N, CUI S H. Valuation and validation of carbon sources and sinks through land cover/use change analysis: The case of Bangkok metropolitan area [J]. Land Use Policy, 2018, 70: 471−478. doi: 10.1016/j.landusepol.2017.11.003 [6] CAO W, YUAN X. Region-County characteristic of spatial-temporal evolution and influencing factor on land use-related CO2 emissions in Chongqing of China, 1997-2015 [J]. Journal of Cleaner Production, 2019, 231: 619−632. doi: 10.1016/j.jclepro.2019.05.248 [7] 方精云, 郭兆迪, 朴世龙, 等. 1981—2000年中国陆地植被碳汇的估算 [J]. 中国科学(D辑:地球科学), 2007, 37(6):804−812.FANG J Y, GUO Z D, PIAO S L, et al. Estimation of carbon sink of Terrestrial vegetation in China from 1981 to 2000 [J]. Science in China (Series D:Earth Sciences), 2007, 37(6): 804−812.(in Chinese) [8] 葛全胜, 戴君虎, 何凡能, 等. 过去300年中国土地利用、土地覆被变化与碳循环研究 [J]. 中国科学(D辑:地球科学), 2008, 38(2):197−210.GE Q S, DAI J H, HE F N, et al. Land use, land cover change and carbon cycle in China during the past 300 years [J]. Science in China (Series D:Earth Sciences), 2008, 38(2): 197−210.(in Chinese) [9] KAUPPI P E, AUSUBEL J H, FANG J Y, et al. Returning forests analyzed with the forest identity [J]. PNAS, 2006, 103(46): 17574−17579. doi: 10.1073/pnas.0608343103 [10] 李颖, 黄贤金, 甄峰. 江苏省区域不同土地利用方式的碳排放效应分析 [J]. 农业工程学报, 2008, 24(S2):102−107.LI Y, HUANG X J, ZHEN F. Effects of land use patterns on carbon emission in Jiangsu Province [J]. Transactions of the Chinese Society of Agricultural Engineering, 2008, 24(S2): 102−107.(in Chinese) [11] 潘岳, 朱继业, 叶懿安. 江苏省碳排放影响驱动因素分析: 基于STIRPAT模型 [J]. 环境污染与防治, 2014, 36(12):104−109. doi: 10.3969/j.issn.1001-3865.2014.12.022PAN Y, ZHU J Y, YE Y A. Analysis of the driving influence factors of carbon emission in Jiangsu Province based on STIRPAT model [J]. Environmental Pollution & Control, 2014, 36(12): 104−109.(in Chinese) doi: 10.3969/j.issn.1001-3865.2014.12.022 [12] 李建豹, 黄贤金, 揣小伟, 等. 长三角地区碳排放效率时空特征及影响因素分析 [J]. 长江流域资源与环境, 2020, 29(7):1486−1496.LI J B, HUANG X J, CHUAI X W, et al. Spatio-temporal characteristics and influencing factors of carbon emissions efficiency in the Yangtze River Delta region [J]. Resources and Environment in the Yangtze Basin, 2020, 29(7): 1486−1496.(in Chinese) [13] 吴长兰, 王东, 苏彦涛. 广东省市域碳排放时空分异特征及影响因素: 基于EDGAR数据的分析 [J]. 地域研究与开发, 2020, 39(1):127−132,151. doi: 10.3969/j.issn.1003-2363.2020.01.023WU Z L, WANG D, SU Y T. Study on spatial-temporal variation and influencing factors of urban carbon emissions in Guangdong Province based on EDGAR data [J]. Areal Research and Development, 2020, 39(1): 127−132,151.(in Chinese) doi: 10.3969/j.issn.1003-2363.2020.01.023 [14] 刘伟玲, 张林波, 龚斌, 等. 深圳市土地利用碳排放环境库兹涅茨曲线协整分析 [J]. 水土保持研究, 2013, 20(4):172−178,2.LIU W L, ZHANG L B, GONG B, et al. Co-integration analysis-based environmental kuznets curve of carbon emission from land use in Shenzhen City [J]. Research of Soil and Water Conservation, 2013, 20(4): 172−178,2.(in Chinese) [15] 赵哲, 陈建成, 白羽萍, 等. 二氧化碳排放与经济增长关系的实证分析 [J]. 中国环境科学, 2018, 38(7):2785−2793. doi: 10.3969/j.issn.1000-6923.2018.07.052ZHAO Z, CHEN J C, BAI Y P, et al. The empirical analysis of the relationship between carbon dioxide emissions and economic growth [J]. China Environmental Science, 2018, 38(7): 2785−2793.(in Chinese) doi: 10.3969/j.issn.1000-6923.2018.07.052 [16] WU Y Z, SHEN J H, ZHANG X L, et al. The impact of urbanization on carbon emissions in developing countries: A Chinese study based on the U-Kaya method [J]. Journal of Cleaner Production, 2016, 135: 589−603. doi: 10.1016/j.jclepro.2016.06.121 [17] 田中华, 杨泽亮, 蔡睿贤. 广东省能源消费碳排放分析及碳排放强度影响因素研究 [J]. 中国环境科学, 2015, 35(6):1885−1891. doi: 10.3969/j.issn.1000-6923.2015.06.035TIAN Z H, YANG Z L, CAI R X. Analysis of Guangdong carbon emissions from energy consumption and the driving factors of its intensity change [J]. China Environmental Science, 2015, 35(6): 1885−1891.(in Chinese) doi: 10.3969/j.issn.1000-6923.2015.06.035 [18] 周纳, 董璐, 陈黎明. 碳排放、经济增长与可持续发展关系的实证 [J]. 统计与决策, 2019, 35(18):130−134.ZHOU N, DONG L, CHEN L M. Empirical study on the relationship between carbon emission, economic growth and sustainable development [J]. Statistics & Decision, 2019, 35(18): 130−134.(in Chinese) [19] 王仲瑀. 京津冀地区能源消费、碳排放与经济增长关系实证研究 [J]. 工业技术经济, 2017, 36(1):82−92. doi: 10.3969/j.issn.1004-910X.2017.01.011WANG Z Y. The empirical study on the relationship between energy consumption, carbon emissions and economic growth in Beijing-Tianjin-Hebei [J]. Journal of Industrial Technological & Economics, 2017, 36(1): 82−92.(in Chinese) doi: 10.3969/j.issn.1004-910X.2017.01.011 [20] 师应来, 胡晟明. 技术进步、经济增长对二氧化碳排放的动态分析 [J]. 统计与决策, 2017(16):149−151.SHI Y L, HU S M. Dynamic analysis of technological progress and economic growth on carbon dioxide emission [J]. Statistics and Decision, 2017(16): 149−151.(in Chinese) [21] 杨国清, 朱文锐, 文雅, 等. 20年来广东省土地利用碳排放强度与效率空间分异研究 [J]. 生态环境学报, 2019, 28(2):332−340.YANG G Q, ZHU W R, WEN Y, et al. Spatial differentiation in the intensity and efficiency of carbon emission from land use in Guangdong Province in past two decades [J]. Ecology and Environmental Sciences, 2019, 28(2): 332−340.(in Chinese) [22] 卢敏, 严会超, 胡武贤, 等. 广东省不同土地利用方式与碳排放规律分析 [J]. 广东农业科学, 2012, 39(7):1−5,9. doi: 10.3969/j.issn.1004-874X.2012.07.001LU M, YAN H C, HU W X, et al. Analyze on the rule of carbon emission of different land use patterns in Guangdong Province [J]. Guangdong Agricultural Sciences, 2012, 39(7): 1−5,9.(in Chinese) doi: 10.3969/j.issn.1004-874X.2012.07.001 [23] 陈芷君, 刘毅华, 林华荣. 广东省土地利用碳排放与经济增长之间的脱钩分析 [J]. 生态经济, 2018, 34(5):26−32.CHEN Z J, LIU Y H, LIN H R. Decoupling analysis of land-use carbon emissions and economic development in Guangdong Province [J]. Ecological Economy, 2018, 34(5): 26−32.(in Chinese) [24] 李玉玲, 李世平, 祁静静. 陕西省土地利用碳排放影响因素及脱钩效应分析 [J]. 水土保持研究, 2018, 25(1):382−390.LI Y L, LI S P, QI J J. Influencing factors on carbon emissions of land uses and analysis of their decoupling effects in Shaanxi Province [J]. Research of Soil and Water Conservation, 2018, 25(1): 382−390.(in Chinese) [25] 张苗, 陈银蓉, 程道平, 等. 土地利用结构和强度变化对碳排放影响分析 [J]. 资源开发与市场, 2018, 34(5):624−628,675. doi: 10.3969/j.issn.1005-8141.2018.05.006ZHANG M, CHEN Y R, CHENG D P, et al. Research on influences of land use structure and intensity change on carbon emissions [J]. Resource Development & Market, 2018, 34(5): 624−628,675.(in Chinese) doi: 10.3969/j.issn.1005-8141.2018.05.006 [26] 樊高源, 杨俊孝. 土地利用结构、经济发展与土地碳排放影响效应研究: 以乌鲁木齐市为例 [J]. 中国农业资源与区划, 2017, 38(10):177−184. doi: 10.7621/cjarrp.1005-9121.20171024FAN G Y, YANG J X. Study on effect of land use structure, economic development and land carbon emission—a case study of Urumqi [J]. Chinese Journal of Agricultural Resources and Regional Planning, 2017, 38(10): 177−184.(in Chinese) doi: 10.7621/cjarrp.1005-9121.20171024 -


 点击查看大图
计量
- 文章访问数: 314
- HTML全文浏览量: 92
- PDF下载量: 19
- 被引次数: 0
